Example of mapping prosody data to a rubric
Overview
Prosody rubrics provide quick, clear, actionable information for educators. Trusted rubrics, such as the NAEP ORF score, are widely used and provide a standardized benchmark.
When building our prosody feature, we referenced a number of recognized rubrics to inform our use cases and create reference models of how our prosody JSON data can be used to generate student prosody scores. These reference models include guideline computations, which enable you to combine several data points to produce both individual prosody skill scores and an aggregate prosody score for a student. Used within a model, these scores can provide educators with levelled measures for their classes and students.
Sample rubric definition
Below is a sample rubric model that can be used to aggregate the various data points our prosody feature returns. This model shows how prosody reference points such as pitch, timing, and punctuation can be leveraged to generate a score mapped to a prosody rubric.
1 | <25% of the words have high expressiveness. |
|---|---|
2 | 25% to 50% of the words have high expressiveness. |
3 | >50% of the words have high expressiveness. |
4 | >75% of the words have high expressiveness. |
5 | At least 90% of the words have high expressiveness. |
Definitions for this model:
High expressiveness: Indicates that pitch has sufficiently changed across a sentence or group of words.*
Low expressiveness: Indicates that pitch has not sufficiently changed across a sentence or group of words.*
Phrasing: Evaluates the number and the positions of pauses, hesitations, and punctuation.
Intonation: Evaluates the pitch variation across a passage.
*Sufficient changes: Variation above or below a pre-defined threshold as outlined in example models provided later in this document.
The engine output
As outlined in the Prosody section, the SoapBox engine can return several prosody-related data points, as demonstrated in this example JSON:
…
	"confidence": 99.51,
	"duration": 0.75,
	"end": 2.79,
	"phone_breakdown": [{...}],
	"phonetic_transcription": "l ay k",
	"pitch": {
           "values": [289, 299, 306, 306, 299, 288, 274, 266, 259, 253, 243,
           244, 259, 253, 246, 242, 237, 232, 230, 230, 228, 226, 225, 223,
           221, 221, 221, 222, 222, 222, 222, 220, 217, 214, 213, 213, 213,
           205, 190, 190, 188, 196, 204, 211, 215, 219, 221, 222, 223, 223,
           223, 223, 223, 224, 225, 226, 228, 229, 230, 231, 232, 233, 234,
           236, 237, 238, 239, 240, 242, 243, 244, 245, 246, 248, 249]
	},
	"start": 2.04,
	"time_since_previous": 0.24,
	"word": "like"
}
pitch: Each word object will contain a pitch object. In the pitch object is an array, which contains all the fundamental excitation frequency (pitch) values for that word.
time_since_previous: Shows the number of seconds since the last spoken word. This returns information to be used to measure phrasing.
punctuation: If detected in the reference text, it may imply that the current word token is at the end of a sentence or phrase, and it requires specific prosody rendering.
Sentence & passage-level expressiveness
Expressiveness can be measured at passage and sentence level using the F0 scores returned.
This is done by concatenating all relevant
pitch: {values[]}objects in sequential order.The expressiveness thresholds can be set to whatever is appropriate for a given task.
Phrasing & emphasis
Timestamps and the
time_since_previousattribute will enable determination of whether appropriate pauses have occurred (e.g., punctuation marks) and whether there are incorrect pauses (e.g., between words).Pitch values
pitch: {values[]}can be used to check if the student raised or lowered their intonation as expected, and the slope of a pitch value array can be derived (e.g., expressive punctuation).Once the slope is calculated, a threshold can be used to determine if the incline or decline was sharp enough to qualify as a rise or fall in intonation.
Example of aggregate score calculation
By leveraging the JSON outputs as illustrated in Prosody Use Cases, computations can be used to generate rubric levels.
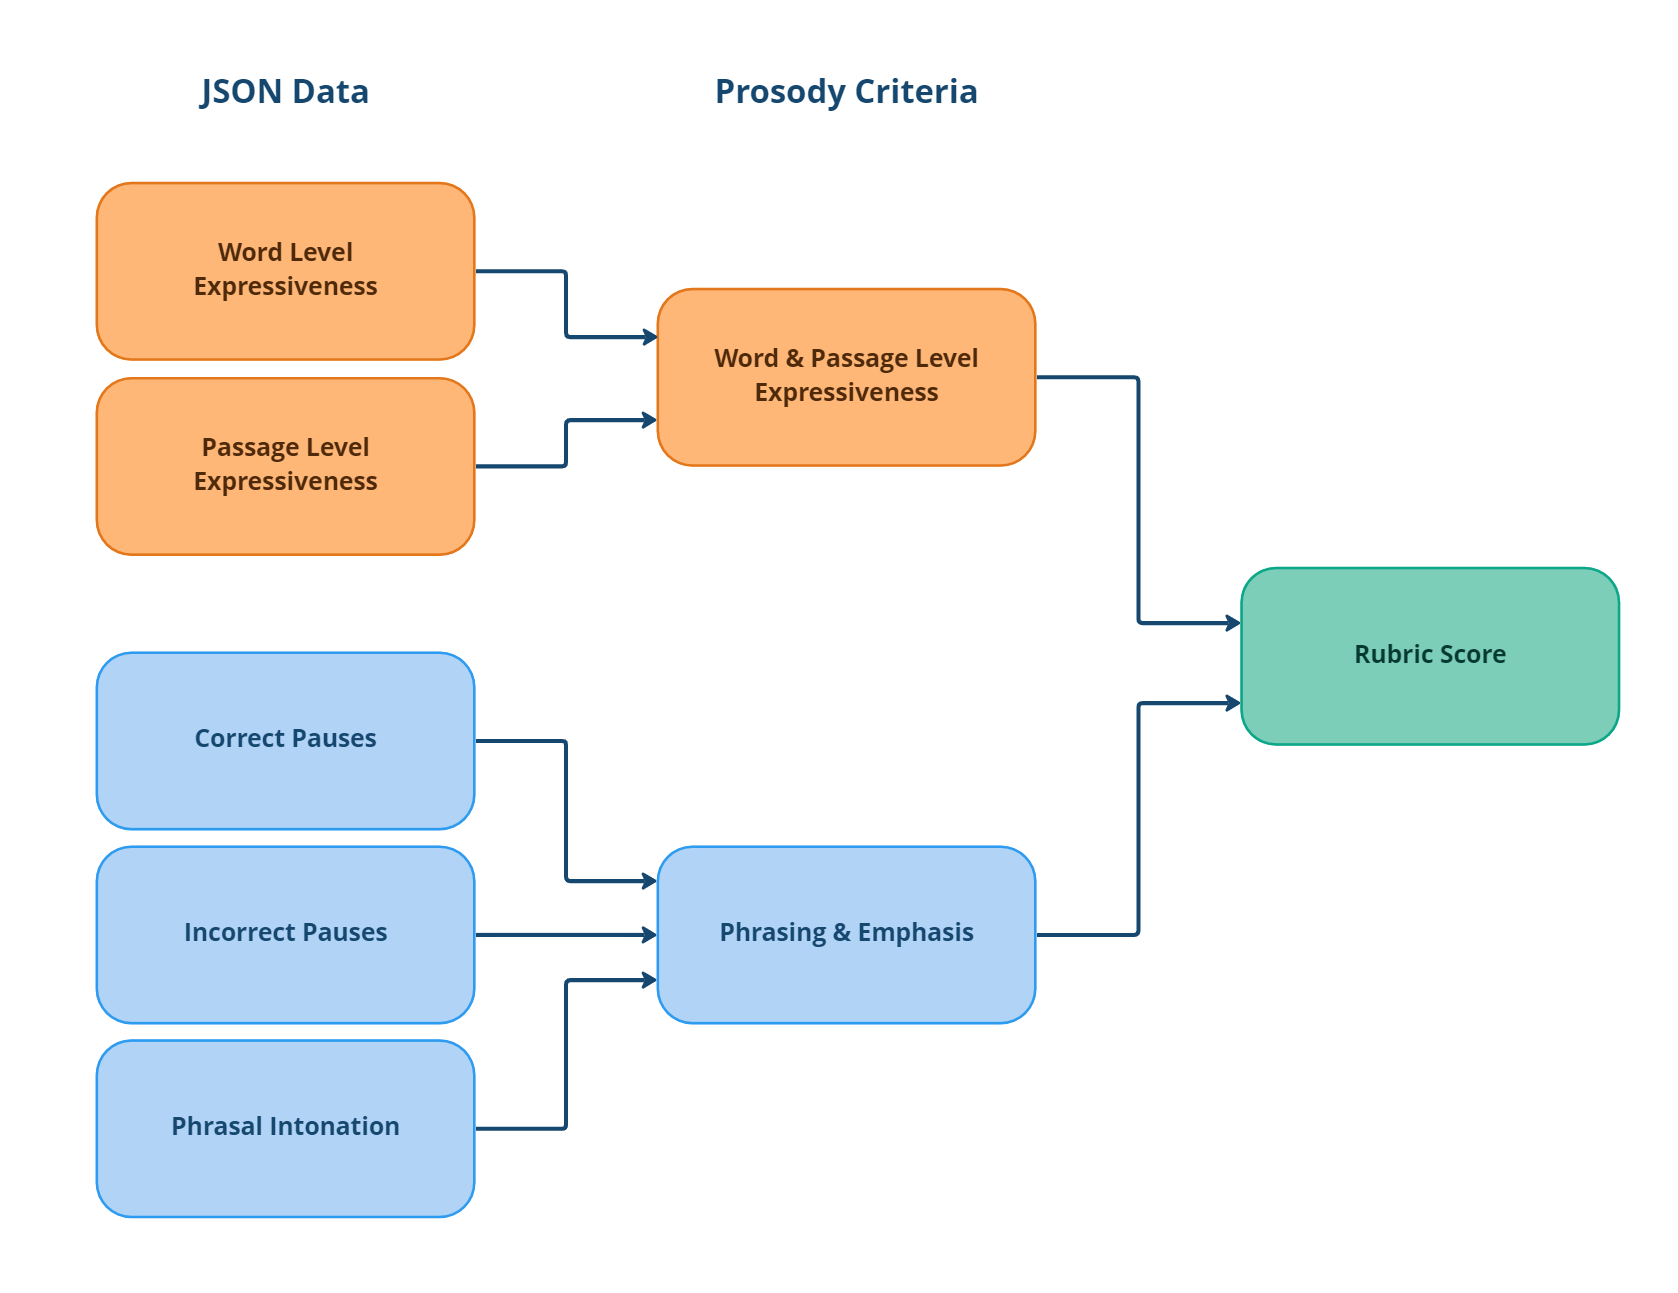
In the diagram below, we show a hierarchy of prosody scoring.
The Rubric Score refers to the overall single score for a student against the prosody model. This is generated from the two individual prosody skills of:
Word & Passage Level Expressiveness
Phrasing & Emphasis
These two prosody skills are scored using a combination of five measures generated by data returned for pitch variation, pauses, and punctuation when reading or speaking.
These dimensions are not prescriptive, and they can be modified and adapted to each customer’s needs and specific use cases.
Rubric score
All individual dimension scores range between 1 and 5. The final Rubric Score is the average of the different dimension scores.
Rubric Score = average (Word & Passage Level Expressiveness, Phrasing & Emphasis)
These dimensions can also be grouped according to the prosody measures above.
Word & Passage Level Expressiveness =
               average (Word Level Expressiveness, Passage Level Expressiveness)
and
Phrasing & Emphasis = average (Correct Pauses, Incorrect Pauses, Phrasing Intonation)
The computation of the individual score for each dimension is reported in the following sections.
Prosody criteria
Word level expressiveness
This score is purely derived by the word-level pitch values. It consists of the proportion of words with high expressiveness out of the total number of words.
As reported in the related use case 3 example, high expressiveness is when the standard deviation of the pitch vector is higher than a threshold (e.g., 26 Hz).
# of expressive words = # of words with std_dev > threshold

percentage = # of expressive words / # of words

score = 1 if 0 < percentage <= 0.25
      = 2 if 0.25 < percentage <= 0.5
      = 3 if 0.5 < percentage <= 0.75
      = 4 if 0.75 < percentage <= 0.9
      = 5 if 0.9 < percentage <= 1
Passage level expressiveness
This score is purely derived by the word-level pitch values.
It measures the variation of the pitch values on the entire passage. As outlined in the related use case 3 example, the passage expressiveness is measured by extracting the standard deviation over all pitch values for the entire passage (overall_std_dev). Since this value has no fixed upper boundary, the chosen method to convert it into a percentage is by using a sigmoid function.
percentage = 1/(1+EXP(-14 * ( overall_std_dev /100-0.5))) * 100

score = 1 if 0 < percentage <= 0.4
      = 2 if 0.4 < percentage <= 0.5
      = 3 if 0.5 < percentage <= 0.6
      = 4 if 0.6 < percentage <= 0.7
      = 5 if 0.7 < percentage <= 1
Phrasing and emphasis
Correct pauses
A correct pause is when a student pauses in the right place (i.e., at a punctuation sign).
This score is derived by the information in the time_since_previous and the punctuation symbols in the reference text.
As described in the use case 1 example, we can check whether the duration of the following pause falls within an appropriate range for each punctuation symbol.
# of accepted pauses = punctuation pauses that are within the accepted range

accepted_percentage = # of accepted pauses / # of punctuations

score = 1 if 0 < accepted_percentage <= 0.25
      = 2 if 0.25 < accepted_percentage <= 0.5
      = 3 if 0.5 < accepted_percentage <= 0.75
      = 4 if 0.75 < accepted_percentage <= 0.9
      = 5 if 0.9 < accepted_percentage <= 1
Incorrect pauses
An incorrect pause is an instance of a pause where there shouldn’t be one.
This score is derived from the information in the time_since_previous attribute.
It measures the ratio between the number of unusual pauses and the total number of words.
The assumption is that a non-proficient speaker would decode rather than speak fluently. Therefore, very often, there will be a pause after each word.
Incorrect pauses can be detected by checking if time_since_previous is longer than a threshold (e.g., 200 ms).
# of incorrect pauses = # of pauses longer than a threshold

incorrect_percentage = 1 - # of incorrect pauses / # of words

score = 1 if 0 < incorrect_percentage <= 0.5
      = 2 if 0.5 < incorrect_percentage <= 0.7
      = 3 if 0.7 < incorrect_percentage <= 0.8
      = 4 if 0.8 < incorrect_percentage <= 0.95
      = 5 if 0.95 < incorrect_percentage <= 1
Phrasal intonation
This score is derived by the word-level pitch values and the punctuation label.
It measures the ratio between the number of points in the passage where the student’s intonation has appropriately changed (e.g., at the end of a sentence) and the total number of punctuation symbols that need to be assessed (e.g., . or ?).
As reported in the use case 2 example, the accepted intonation is when the trend of the pitch of the word before the punctuation symbol has an acceptable slope (e.g., >130 or <-90 for ? and <-90 for .).
# of accepted intonation = trend of the pitch array on the word
                           before the assessed punctuation is above
                           or below a threshold

percentage = # of accepted intonation points / # of assessed punctuations

score = 1 if 0 < percentage <= 0.25
      = 2 if 0.25 < percentage <= 0.5
      = 3 if 0.5 < percentage <= 0.75
      = 4 if 0.75 < percentage <= 0.9
      = 5 if 0.9 < percentage <= 1
Examples
Good expressivity
Sample reading: Listen to audio file here
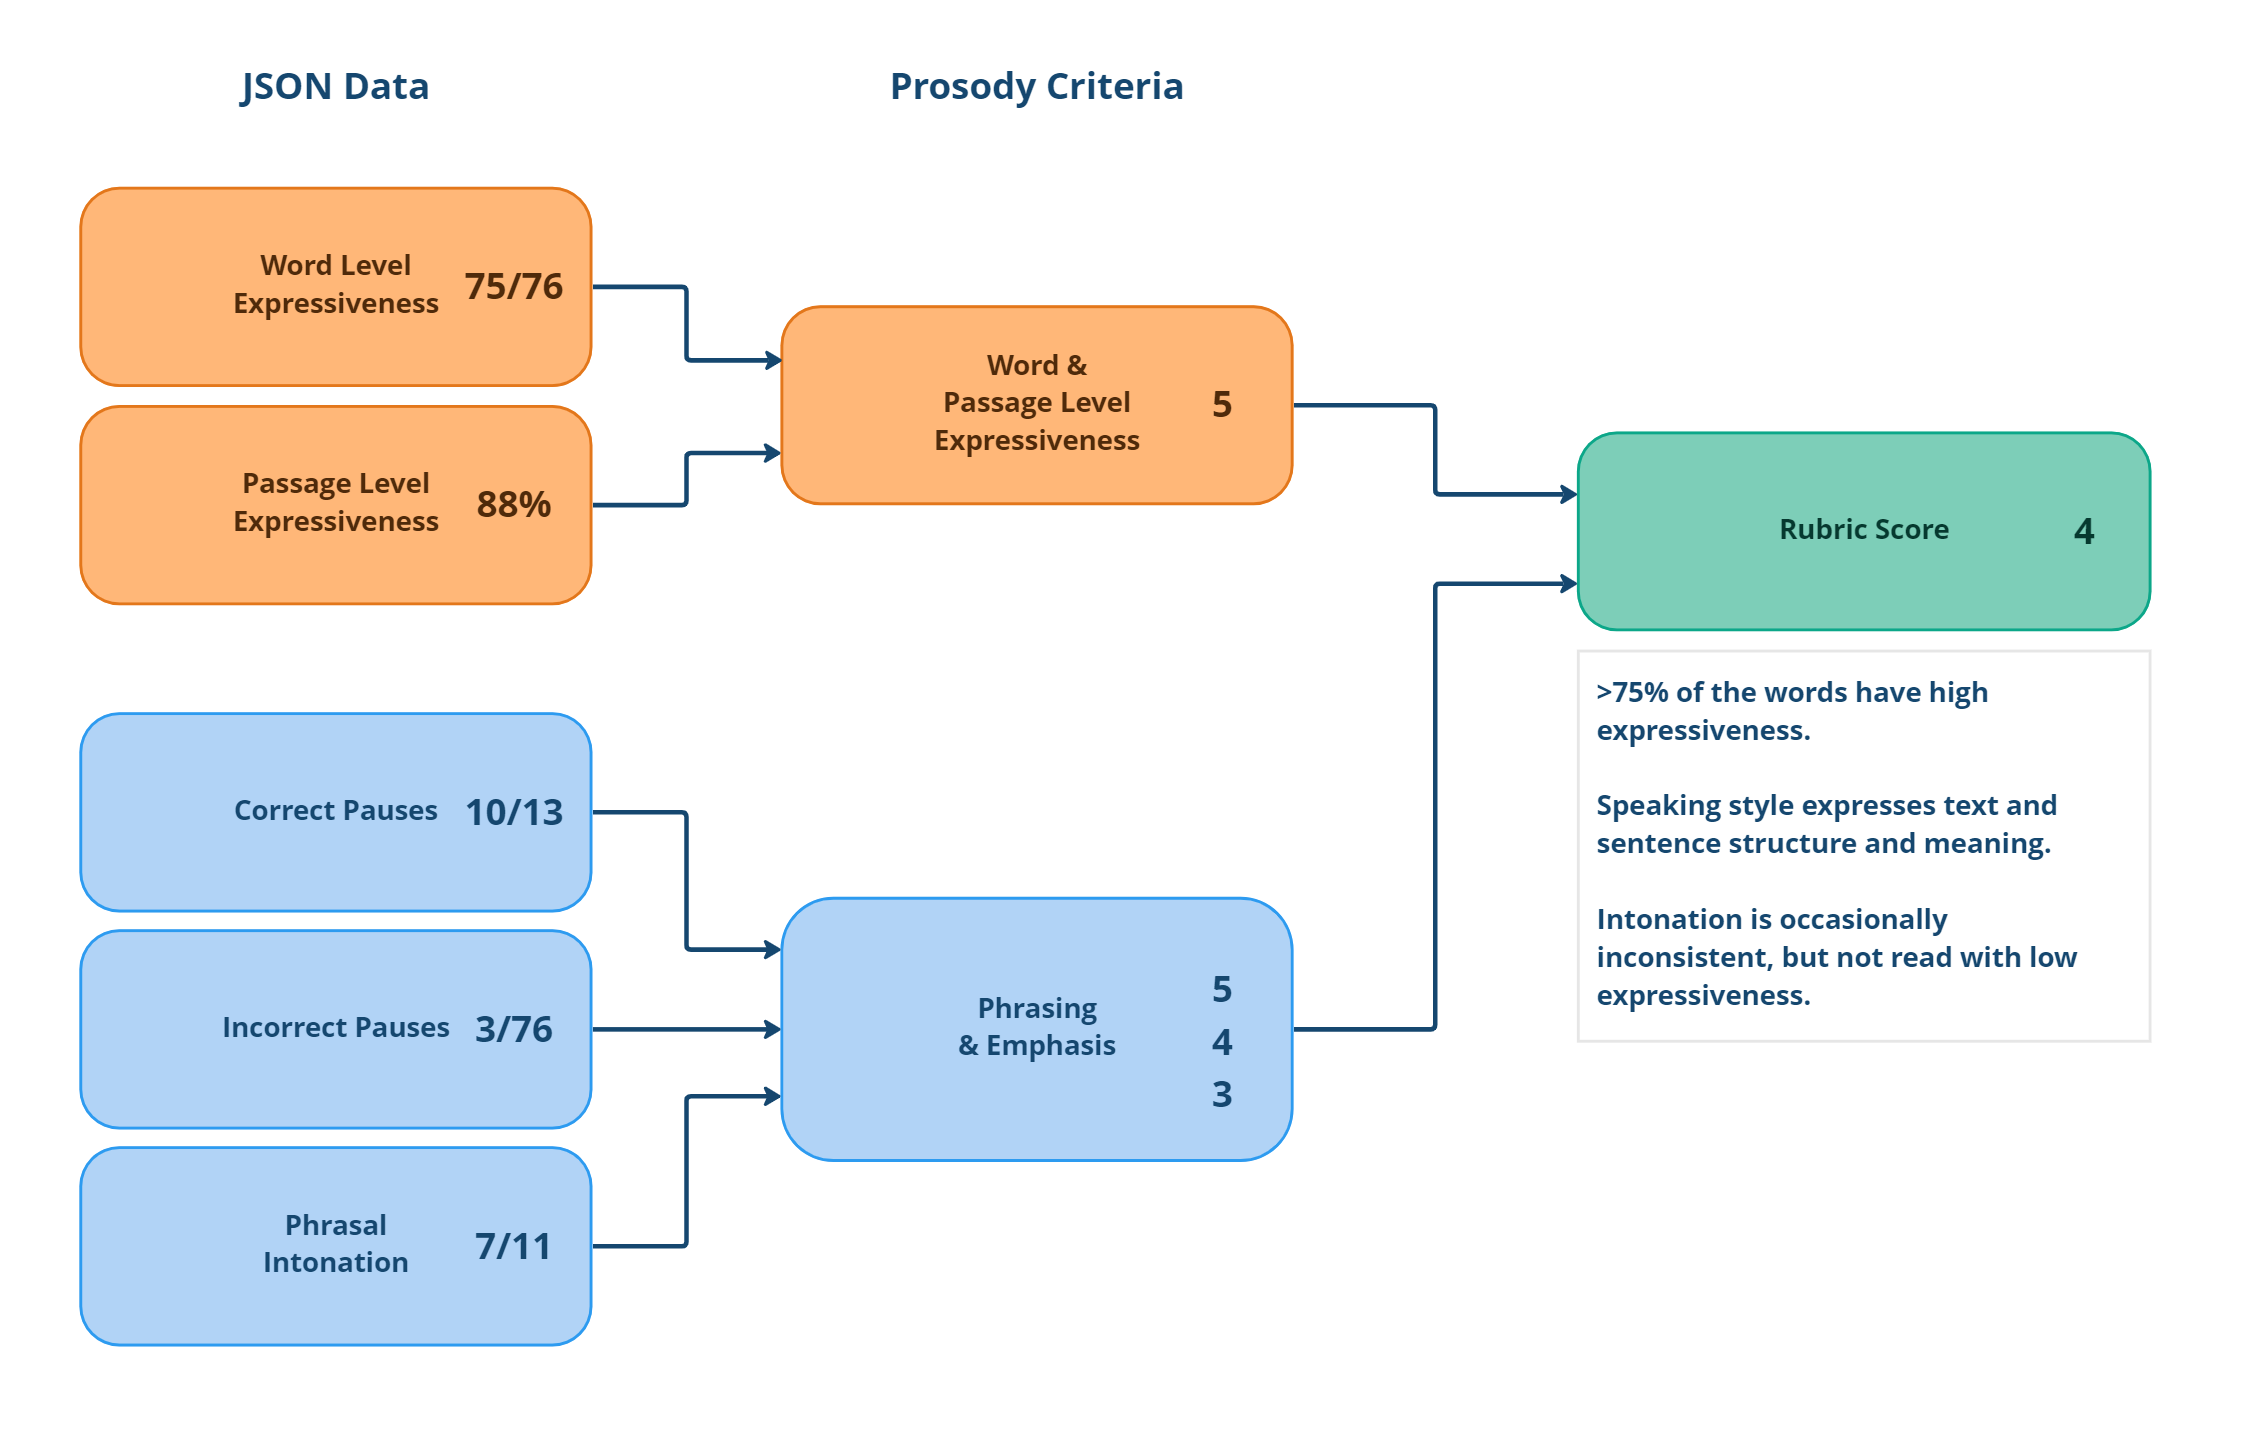
Taking the above audio sample where the child read well, the rubric score would be be calculated like this:
A further breakdown would look like this:
JSON Data | Details | Percentage | Score |
|---|---|---|---|
Word level expressiveness | 75 of 76 words had high expressiveness | 5 | |
Passage level expressiveness | The variation of the pitch values on the entire passage | 88% | 5 |
Correct pauses | 10 of a potential 13 pauses were observed correctly | 3 | |
Incorrect pauses | 3 instances where the child paused where they shouldn’t have (out of a potential 76) | 3 | |
Phrasal intonation | 7 out of a potential 11 times where the intonation was appropriately changed | 2 | |
Rubric score | Rubric score is the average of the different dimension scores | 4 |
Poor expressivity
Sample reading: Listen to audio file here
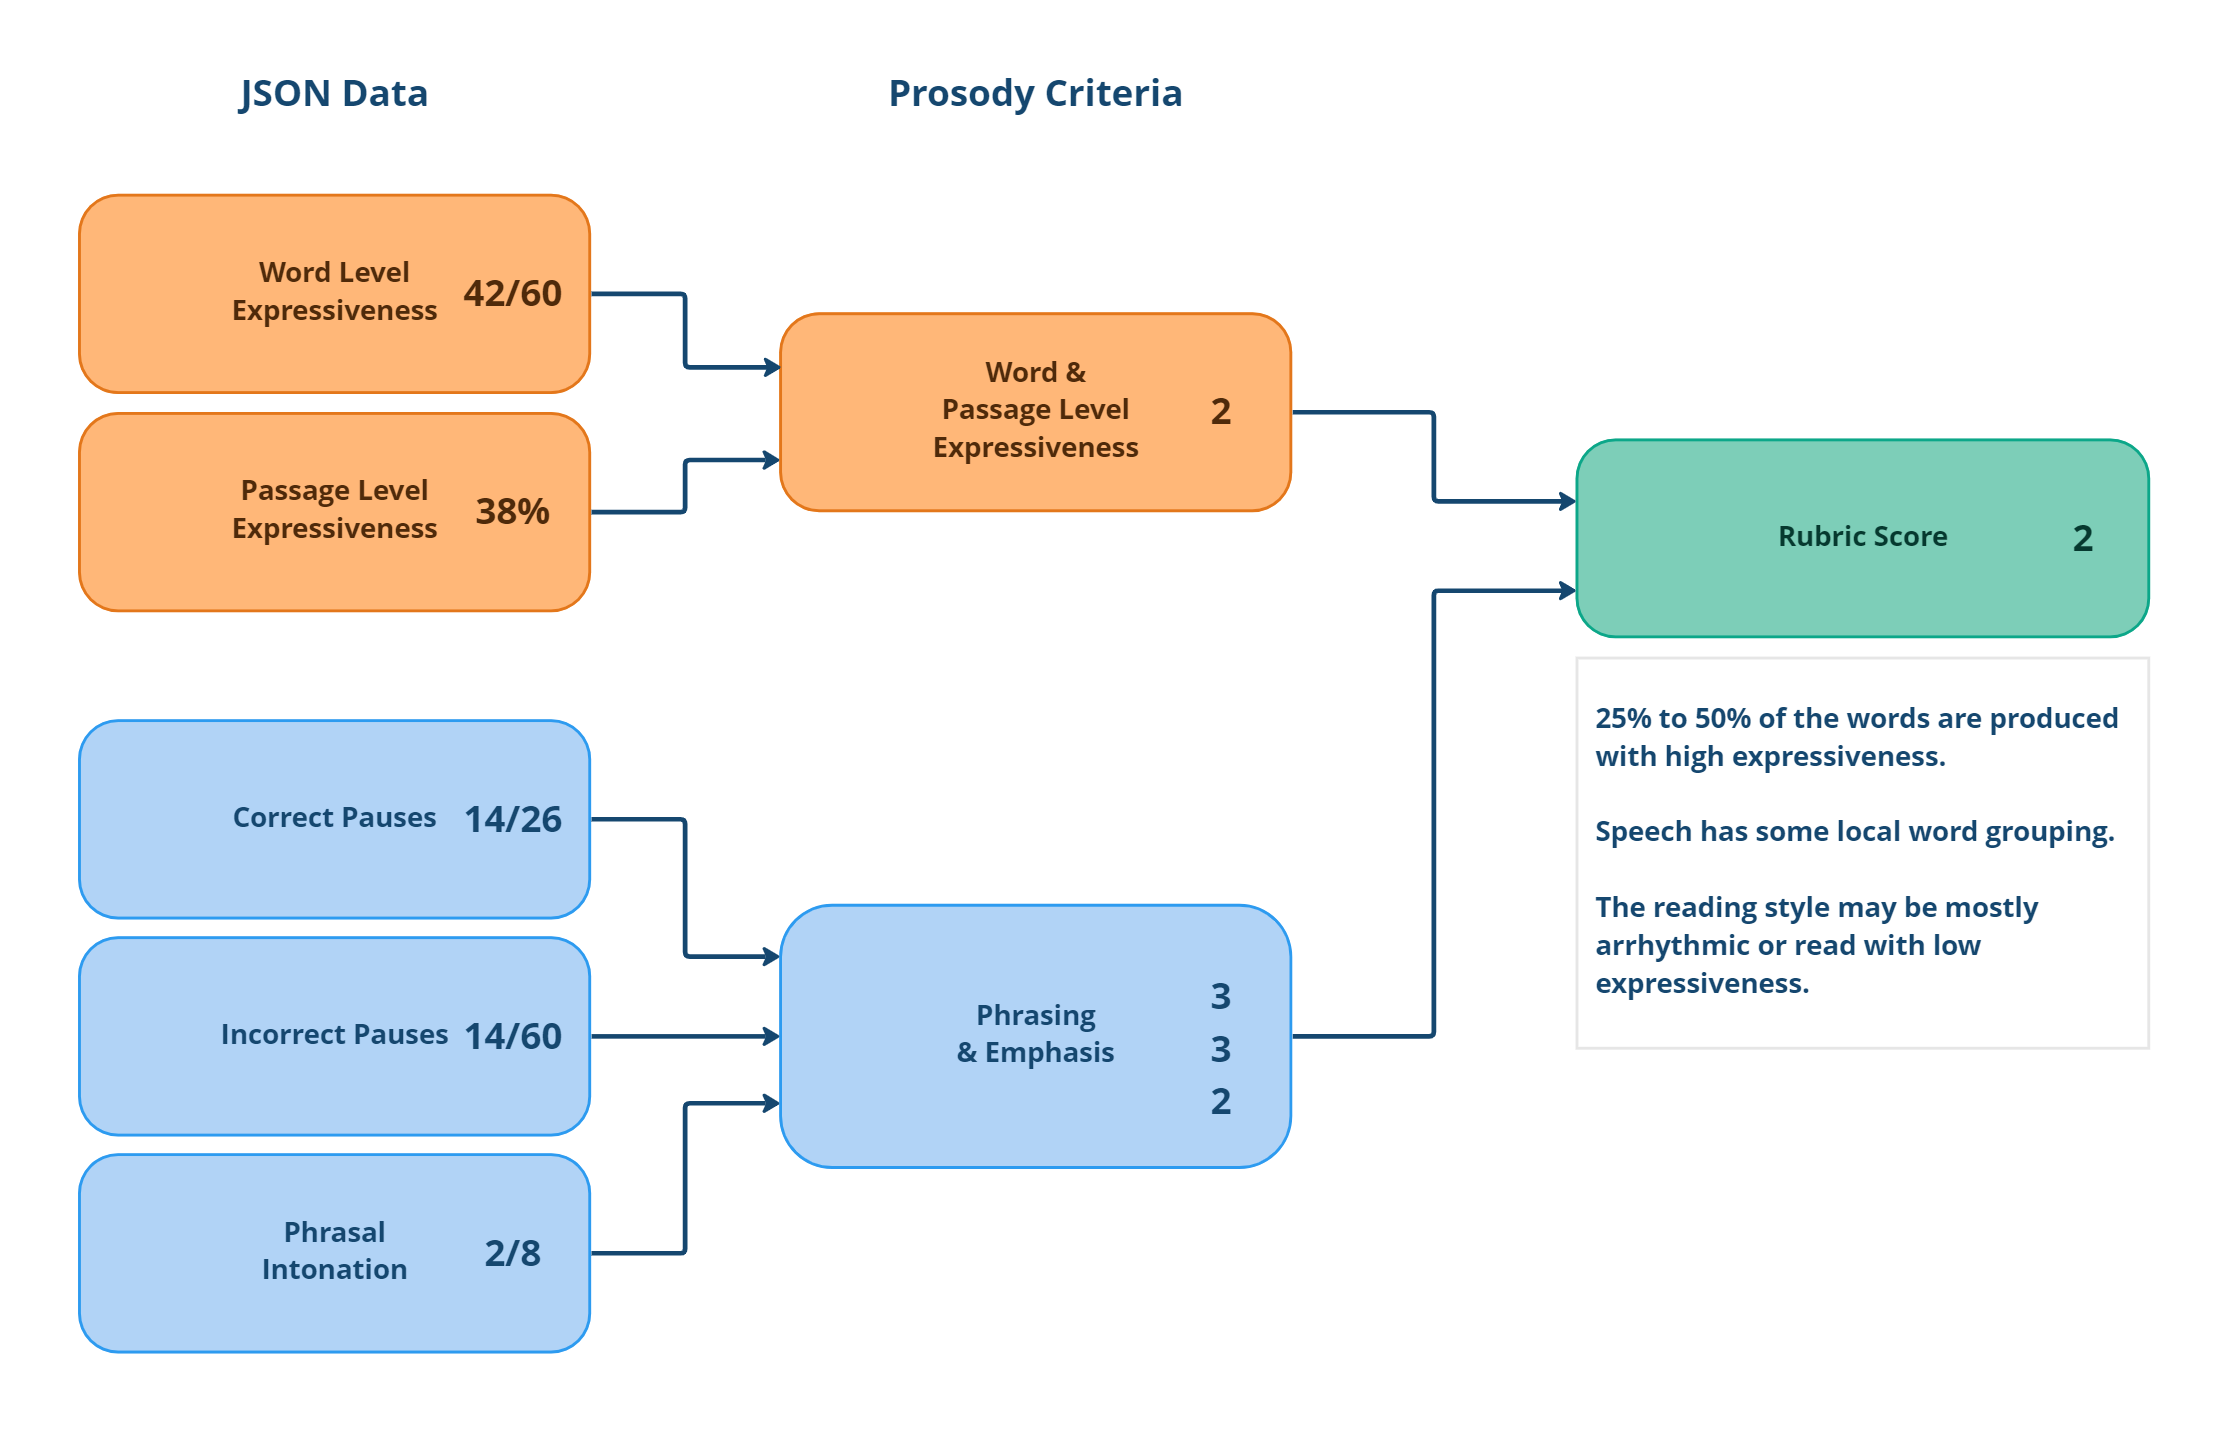
If we take the above audio sample where the child read with poor expressivity, the rubric score would be be calculated like this:
JSON Data | Details | Percentage | Score |
|---|---|---|---|
Word level expressiveness | 42 of 60 words had high expressiveness | 3 | |
Passage level expressiveness | The variation of the pitch values on the entire passage | 38% | 1 |
Correct pauses | 14 of a potential 26 pauses were observed correctly | 3 | |
Incorrect pauses | 14 instances where the child paused where they shouldn’t have (out of a potential 60) | 3 | |
Phrasal intonation | 2 out of a potential 8 times where the intonation was appropriately changed | 2 | |
Rubric score | Rubric score is the average of the different dimension scores | 2 |
Resources
Audio files mentioned above
File for Good Expressivity example:
File for Poor Expressivity sample:


